


Introduction
In scientific experiments, calculations, and data analysis, accuracy is crucial. One of the key measures used to assess the accuracy of an experimental result is the percent error. Understanding how to calculate and interpret percent error can help in evaluating the reliability of results and making necessary adjustments. This article will explore the percent error formula, discuss its relevance, and cover related concepts such as the standard error formula, the use of a percent error calculator, and methods to calculate and find the margin of error.
Table of Contents
What is Percent Error?
Percent error is a measure used to quantify the difference between an experimental value and a true or accepted value. It expresses this difference as a percentage of the accepted value, making it easier to understand and compare. The formula for percent error is:


This metric is widely used in scientific research, engineering, and various fields where precision and accuracy are essential. A low percent error indicates that the experimental result is close to the true value, while a high percent error suggests a significant discrepancy, which may warrant further investigation.
Relevance in Experiments
In experiments, percent error helps researchers determine the reliability of their findings. For instance, in chemistry, when measuring the concentration of a solution, the percent error can indicate whether the measured concentration is accurate. Similarly, in physics, percent error can assess the accuracy of measurements like distance, velocity, or force.
By calculating percent error, scientists and engineers can identify potential errors in their methodology, instrumentation, or calculations. This helps in refining their techniques and improving the overall quality of their work.
Types of Errors: Systematic vs. Random
Systematic Errors
Systematic errors are consistent and predictable deviations from the true value, often caused by faulty equipment, incorrect calibration, or biased experimental methods. These errors can lead to a high percent error if not identified and corrected.
Random Errors
Random errors, on the other hand, are unpredictable fluctuations that occur during measurements. These can be due to factors like environmental changes, human error, or limitations in measurement precision. Random errors are typically smaller and can be averaged out over multiple trials, resulting in a lower percent error.
How to Calculate Percent Error


Step-by-Step Guide
- Determine the Experimental Value: This is the value obtained from the experiment or measurement.
- Identify the Accepted Value: This is the true or standard value that is widely accepted or theoretically determined.
- Subtract the Accepted Value from the Experimental Value: This gives you the error or deviation.
- Divide the Error by the Accepted Value: This step normalizes the error relative to the accepted value.
- Multiply by 100: Converting the result into a percentage provides the percent error.
Example Calculation
Suppose a student measures the density of a substance and obtains a value of 8.5 g/cm³. The accepted density for the substance is 8.3 g/cm³. The percent error would be calculated as follows:

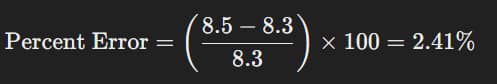
This result indicates a small error in the measurement, suggesting that the student’s result is reasonably accurate.
Standard Error Formula
Definition and Application
The standard error is a measure of the statistical accuracy of an estimate. It represents the standard deviation of the sampling distribution of a statistic, most commonly the mean. The formula for standard error is:


where 𝑛 is the sample size. The standard error decreases as the sample size increases, indicating more precise estimates.
Importance in Data Analysis
In data analysis, the standard error helps quantify the uncertainty associated with an estimate. It is often used to construct confidence intervals, which provide a range within which the true value is likely to fall. A smaller standard error implies a more precise estimate, while a larger standard error suggests greater variability in the data.
Relation to Percent Error
While standard error and percent error are distinct concepts, both are important in assessing the reliability of results. Percent error evaluates the accuracy of a single measurement, whereas standard error assesses the precision of multiple measurements or estimates.
Percent Error Calculator
Overview and Benefits
A percent error calculator is a useful tool for quickly and accurately calculating percent error without the need for manual calculations. These calculators are widely available online and can handle a variety of input formats, making them convenient for students, researchers, and professionals.
How to Use a Percent Error Calculator
To use a percent error calculator, simply input the experimental value and the accepted value into the designated fields. The calculator will automatically compute the percent error based on the formula discussed earlier. This tool can save time and reduce the risk of calculation errors, especially when dealing with complex or multiple datasets.
Recommended Online Calculators
Several online platforms offer reliable percent error calculators. Some popular options include:
- Calculator.net: Provides a straightforward interface for calculating percent error, along with other statistical measures.
- RapidTables: Offers a comprehensive percent error calculator with additional options for related calculations.
- Omni Calculator: Features a user-friendly percent error calculator with explanations of the steps involved.
How to Calculate Percent Error: A Practical Guide
Practical Tips for Accurate Calculations
When calculating percent error, it’s important to follow a systematic approach to ensure accuracy. Here are some practical tips:
- Double-Check Values: Ensure that the experimental and accepted values are correctly identified and inputted.
- Use Consistent Units: Both values should be in the same units to avoid skewed results.
- Consider Significant Figures: The percent error should be reported with the appropriate number of significant figures based on the precision of the measurements.
Common Mistakes to Avoid
- Ignoring Sign: Percent error is typically expressed as an absolute value, so negative results should be converted to positive.
- Rounding Too Early: Avoid rounding intermediate calculations too early, as this can lead to inaccuracies in the final result.
- Overlooking Calibration: Ensure that instruments are properly calibrated to minimize systematic errors that could affect the percent error.
How to Find Percent Error
Step-by-Step Process
Finding percent error involves a few straightforward steps, as outlined earlier. However, when working with large datasets or complex experiments, additional considerations may come into play.
Example Scenarios
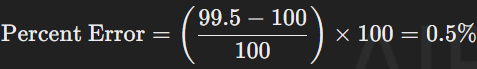
- Laboratory Measurements: In a chemistry lab, a student measures the boiling point of water as 99.5°C, while the accepted value is 100°C. The percent error is calculated as:

- Engineering Calculations: An engineer measures the tensile strength of a material as 250 MPa, while the accepted value is 255 MPa. The percent error is:


These examples illustrate how percent error can be used in different contexts to assess the accuracy of measurements.
How to Calculate Margin of Error
Understanding Margin of Error
The margin of error is a statistic that quantifies the amount of random sampling error in a survey’s results. It provides a range within which the true population parameter is expected to fall. The formula for margin of error is:

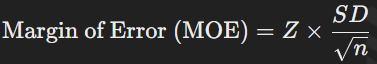
where Z is the Z-score corresponding to the desired confidence level, SD is the standard deviation, and n is the sample size.
Calculating Margin of Error: Step-by-Step
- Determine the Confidence Level: Common confidence levels include 90%, 95%, and 99%.
- Find the Z-Score: The Z-score corresponds to the selected confidence level (e.g., 1.96 for 95% confidence).
- Calculate the Standard Deviation: This is the variability in the data.
- Compute the Margin of Error: Multiply the Z-score by the standard deviation divided by the square root of the sample size.
Example Calculation
Suppose a survey of 500 people yields a standard deviation of 4.5. To calculate the margin of error at a 95% confidence level:

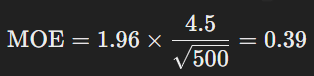
This means the survey results are expected to be within 0.39 units of the true population parameter, 95% of the time.
You can also read the The Pros and Cons of AI in Education.
How to Find the Margin of Error
Practical Applications
The margin of error is widely used in public opinion polls, market research, and other fields where sample data is used to make inferences about a larger population. Understanding how to find and interpret the margin of error is crucial for accurately reporting and interpreting survey results.
Reducing the Margin of Error
To reduce the margin of error, researchers can:
- Increase the Sample Size: A larger sample size decreases the standard error, which in turn reduces the margin of error.
- Reduce Variability: Decreasing the standard deviation within the sample data can also lower the margin of error.
- Choose a Lower Confidence Level: While this increases the risk of error, it will result in a smaller margin of error.
Conclusion
Understanding the percent error formula, standard error formula, and how to calculate and find the margin of error are essential skills in both scientific research and data analysis. These concepts help quantify accuracy, precision, and uncertainty, enabling researchers and professionals to make more informed decisions. Whether you’re working in a laboratory, conducting a survey, or analyzing data, mastering these formulas will enhance the quality and reliability of your work.


